SeeD3
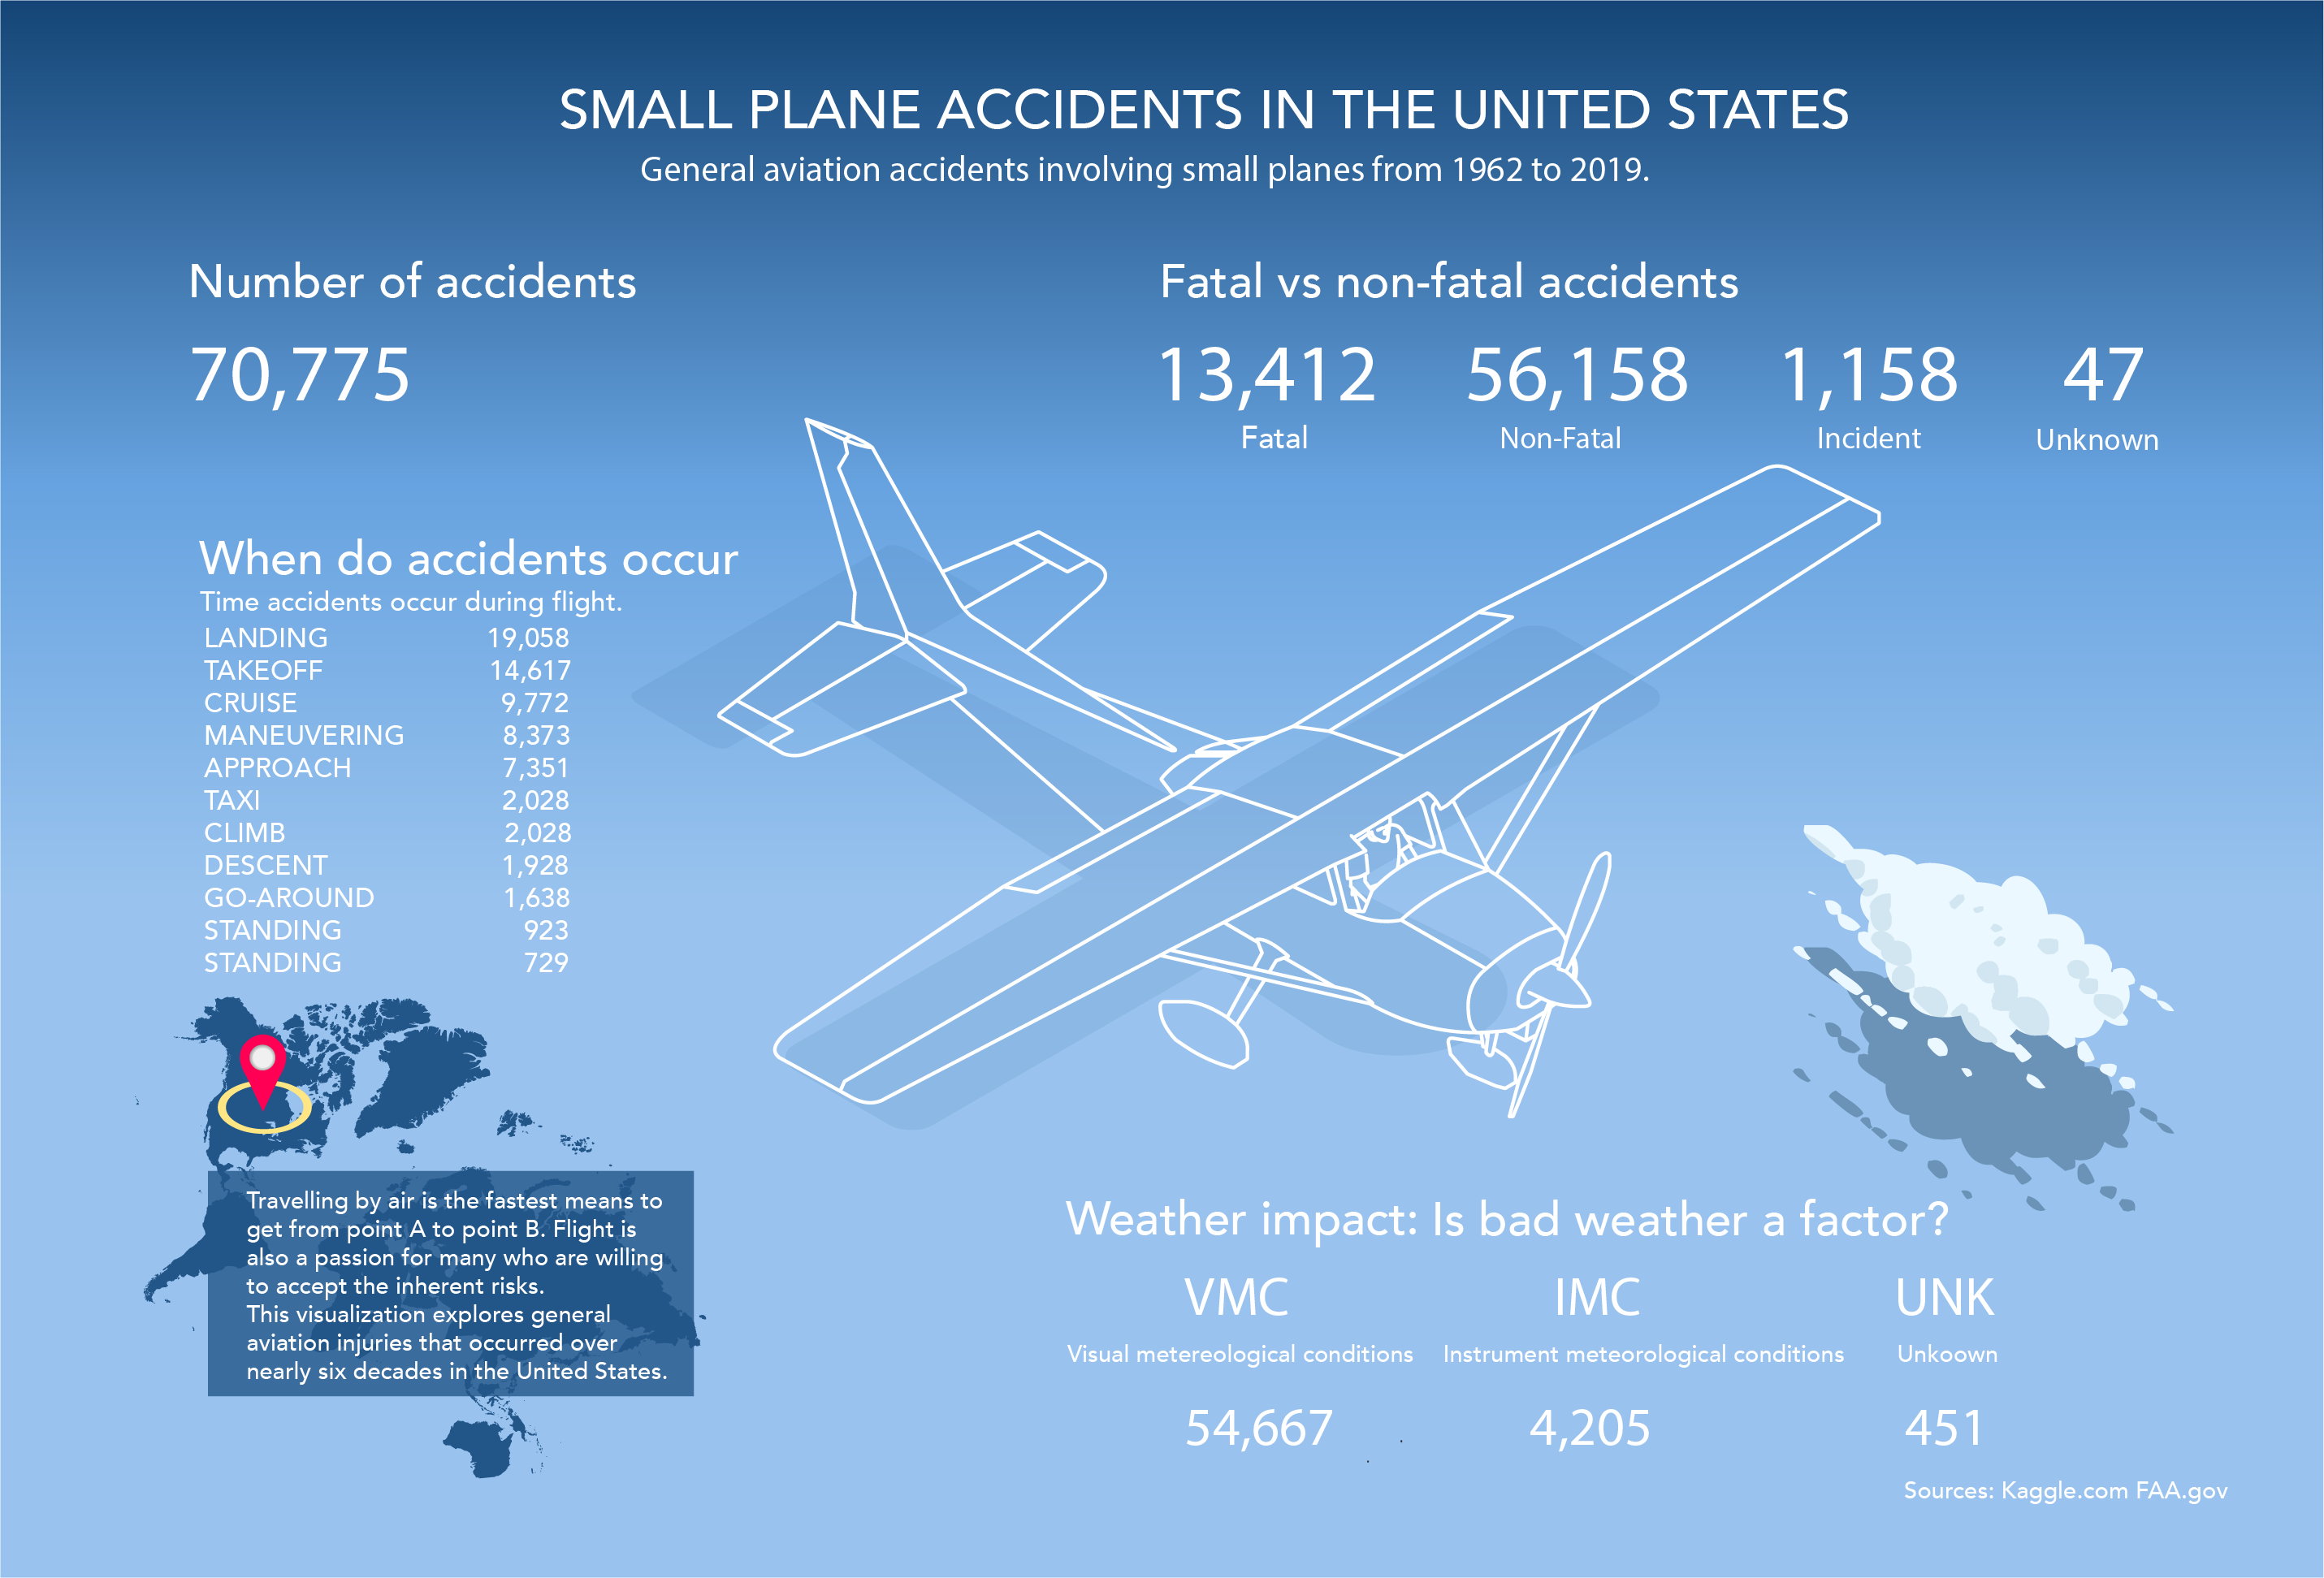
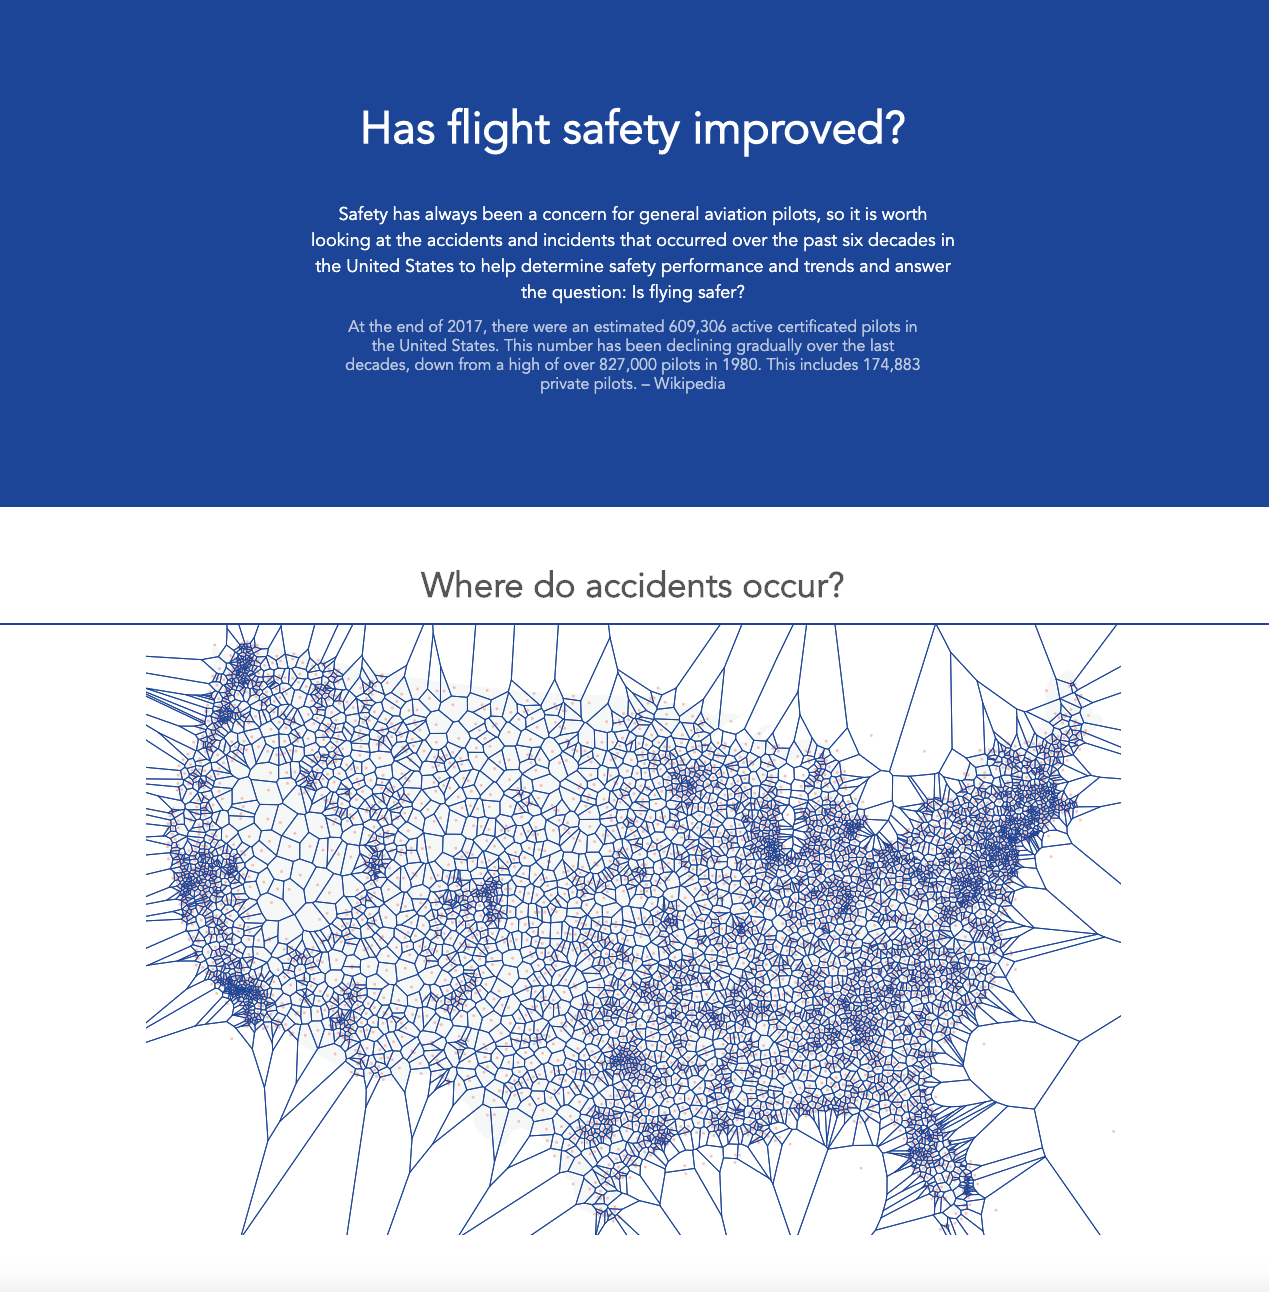
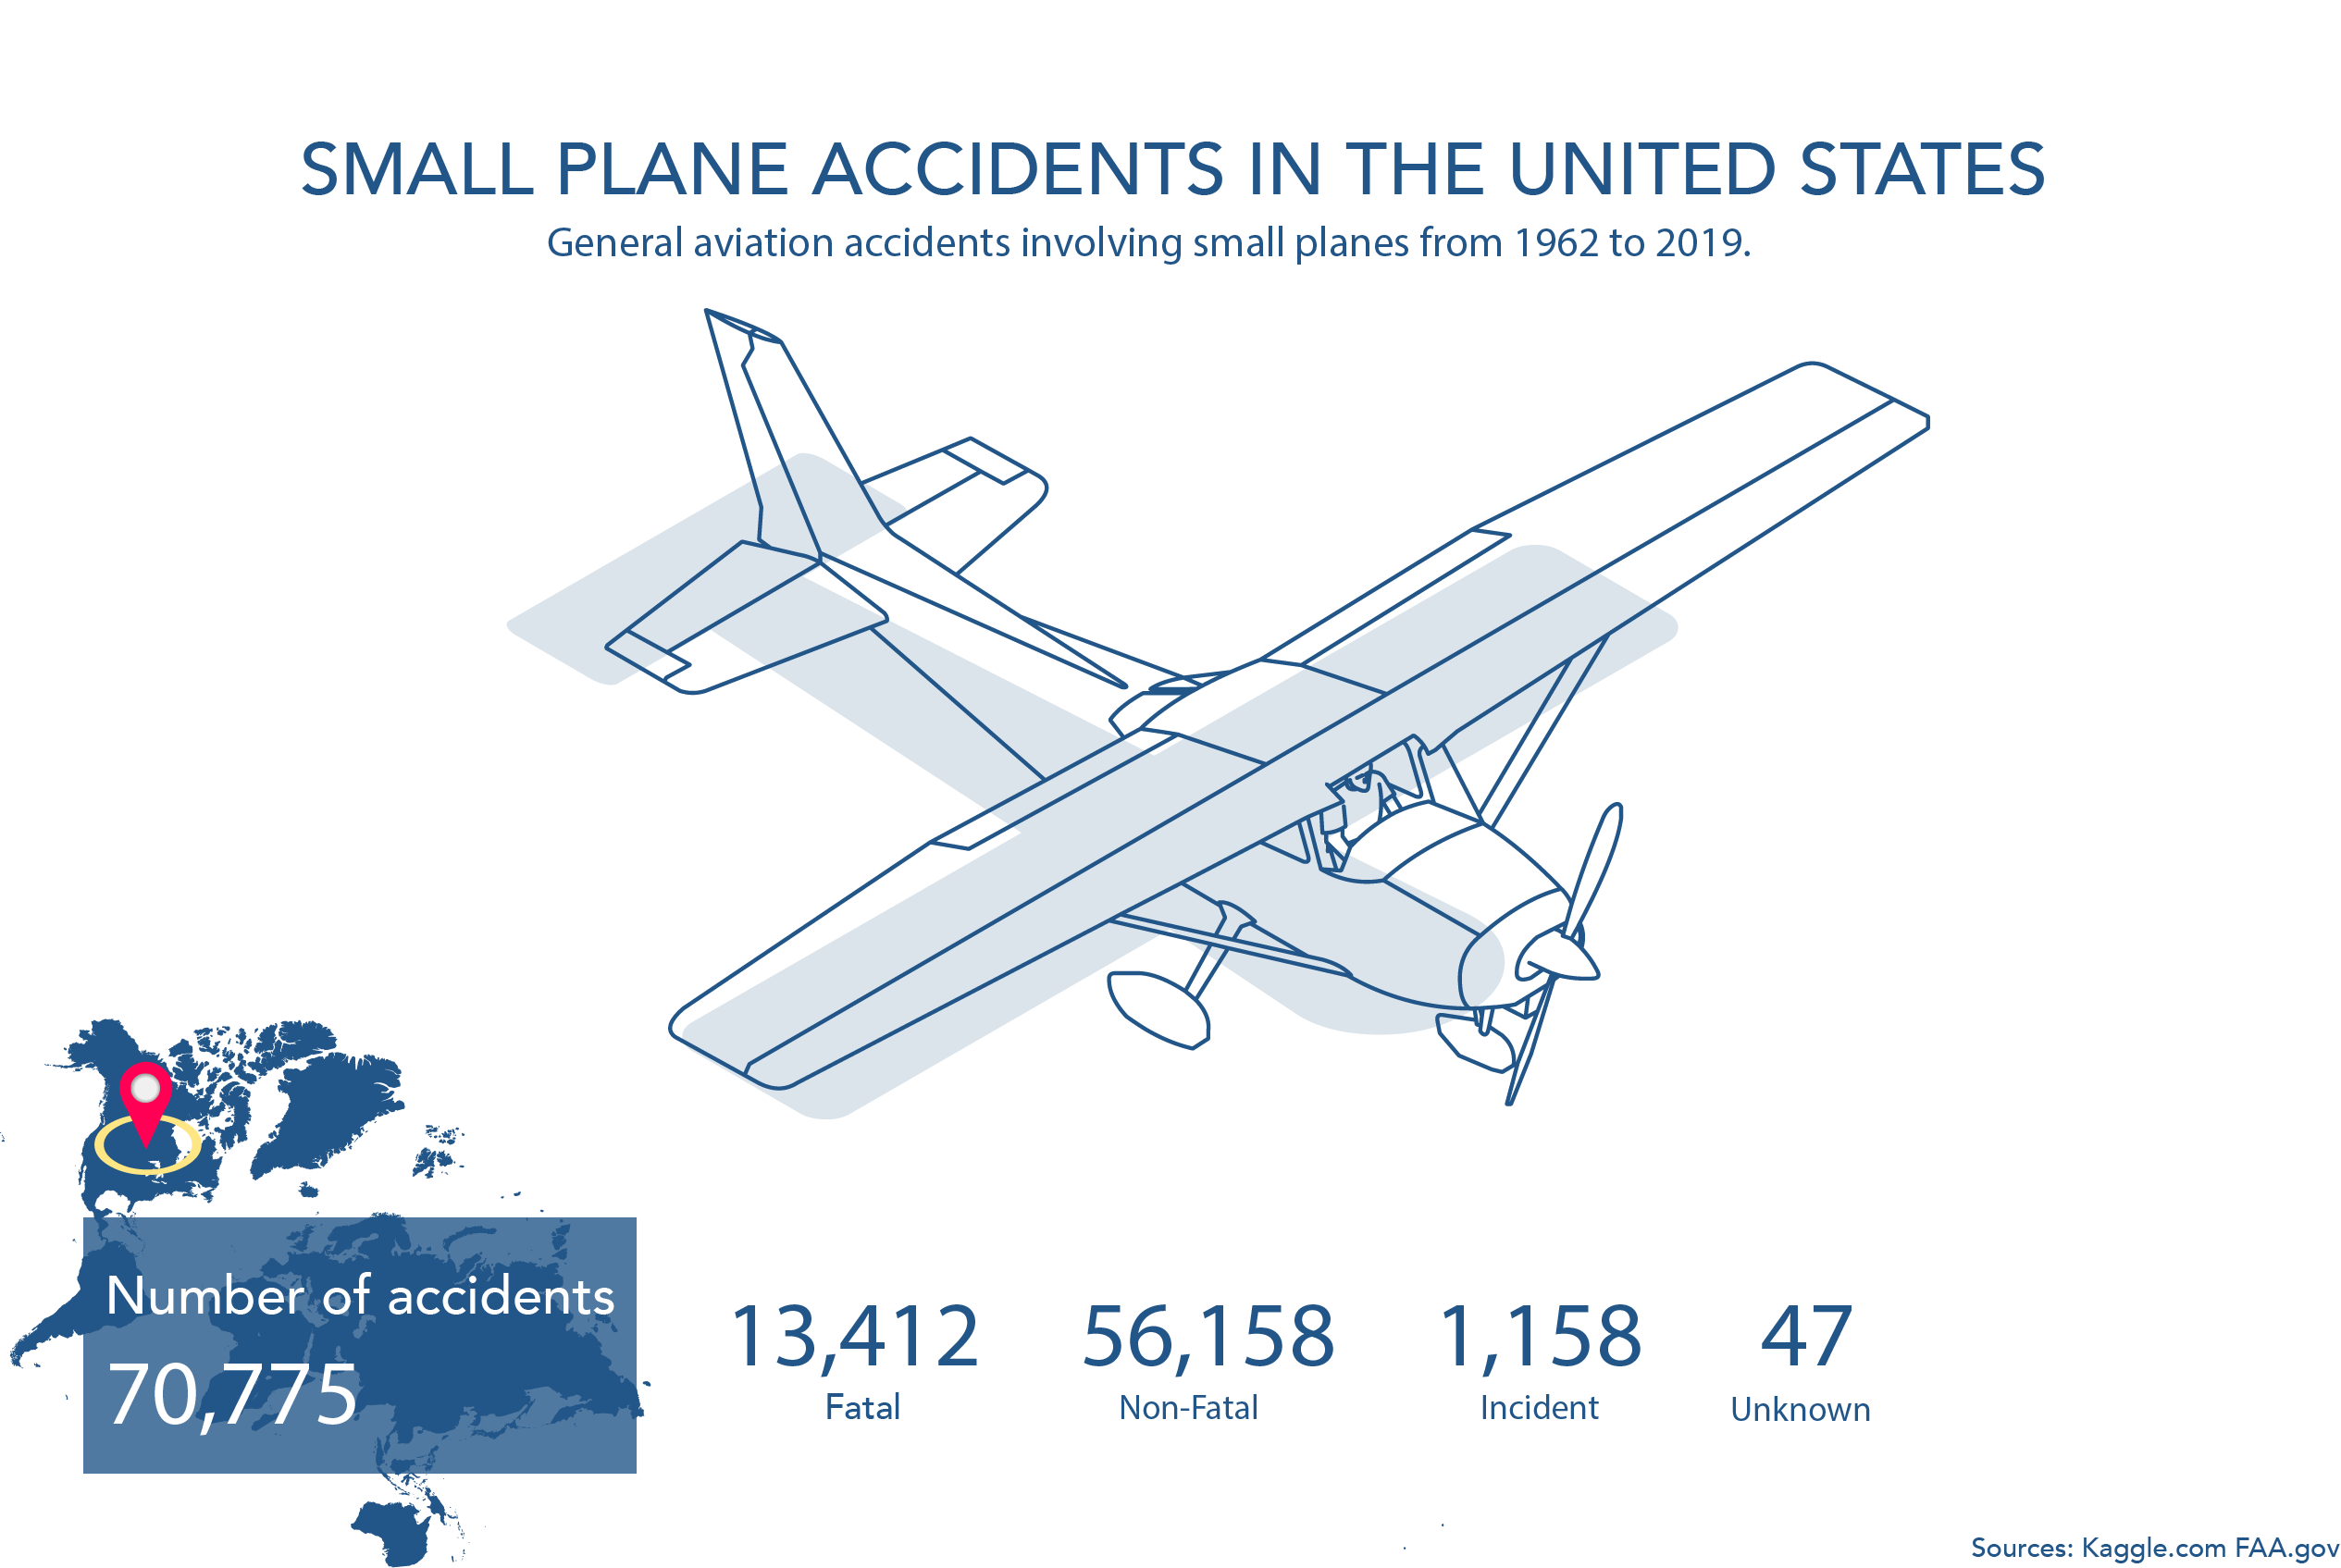
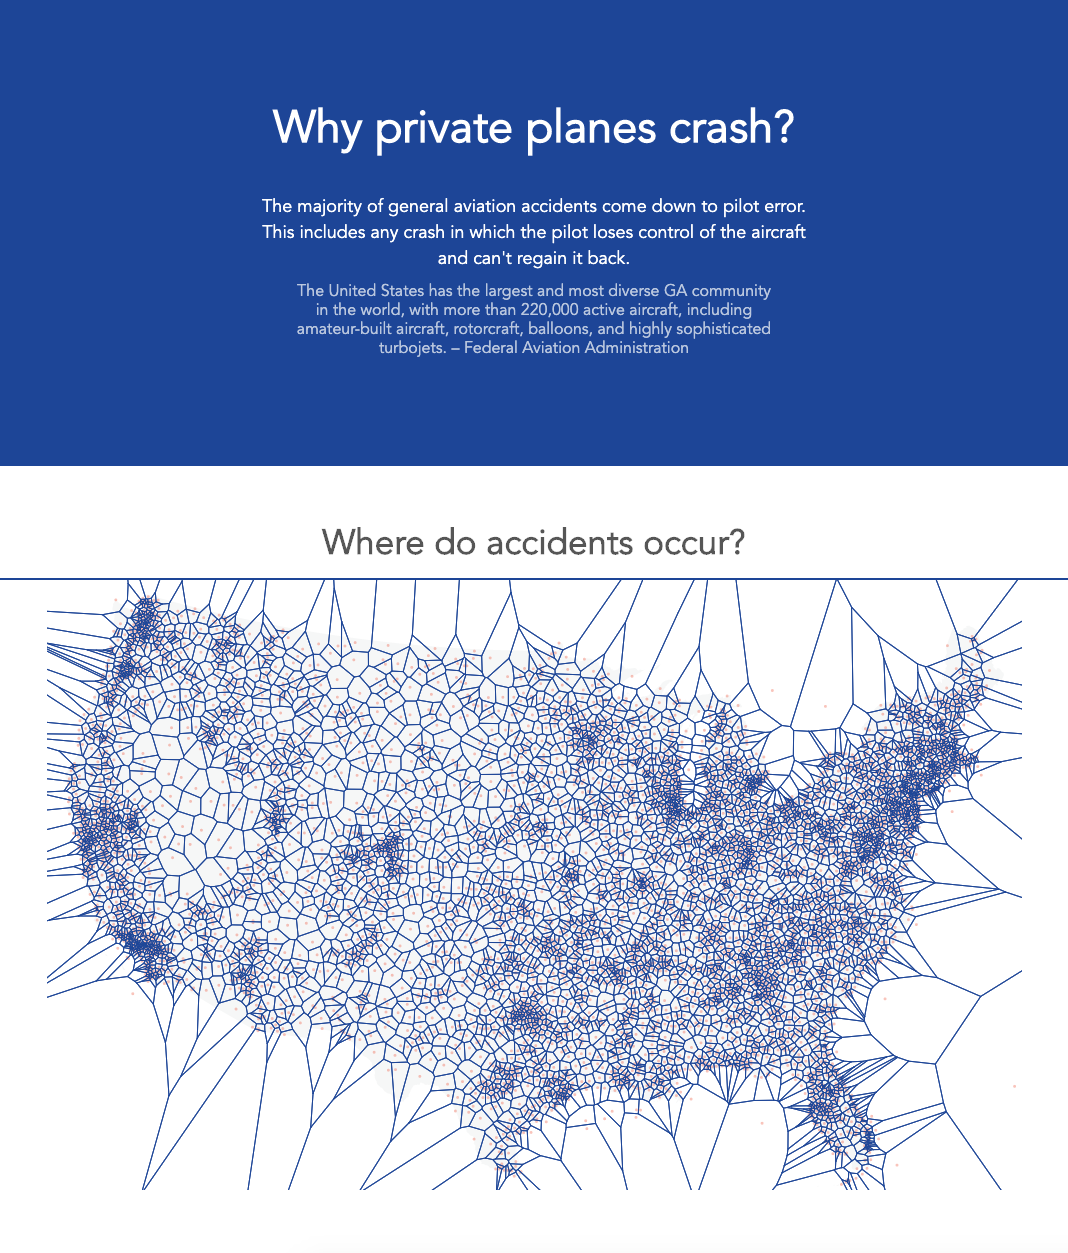
These visualizations explore general aviation injuries that occurred over six decades in the United States. How many are fatal and whether they declined as flight technologies improved. The Voronoi map allows the viewer to explore the location of accidents and to see the clusters that indicate where most of the accidents occurred.
Exploratory Visualization
View Visualization.
Narrative Visualization
View Visualization.